Gene Ontology testing with clusterProfiler
Last updated on 2025-12-02 | Edit this page
Estimated time: 12 minutes
Overview
Questions
- What are the different types of GO terms (BP, MF, CC)?
- How do we perform ORA using
enrichGO()function? - How can we run GSEA-style functional class scoring with
gseGO()function?
Objectives
- Apply GO-based enrichment methods using
clusterProfiler - Perform both ORA and GSEA using the GO terms database
- Build confidence in navigating GO resources and interpreting enriched terms
Introduction
The Gene Ontology (GO) project is a major bioinformatics initiative
that standardises how we describe gene functions across species,
organising them into three categories: Biological Process, Molecular
Function and Cellular Component. clusterProfiler is an R
package that allows us to test whether these GO terms are associated
with our RNA-seq results and gain insight into the pathways or functions
represented in our data. This section demonstrates how to perform both
over-representation analysis (ORA) and
functional class scoring (FCS) with GO database,
depending on whether you are working with a list of significant genes or
full ranked expression data.
Over-Representation Analysis (ORA)
ORA tests whether a list of significant genes are linked to specific GO terms. The input is a vector of gene IDs (or list of genes) that passes your differential expression cut-off. ORA can be run separately for downregulated and upregulated genes to reveal which GO terms are enriched in each direction.
We first subset the debasal dataset to extract genes
with adjusted p-value below 0.01 and store this set of significant genes
in an object called genes. We then run enrichGO function
using this gene list, specifying the organism database
org.Mm.eg.db, the identifier type ENTREZID and
the GO category of interest CC (for cellular component).
The function is configured with standard p-value and q-value, using
Benjamini-Hochberg correction. We use the function head()
to check the first few lines of output.
R
debasal$Status <- debasal$adj.P.Val < 0.01
gene <- debasal$ENTREZID[debasal$Status]

ego <- enrichGO(gene = gene,
                OrgDb = org.Mm.eg.db,
                keyType = 'ENTREZID',
                ont = "CC",
                pAdjustMethod = "BH",
                pvalueCutoff = 0.01,
                qvalueCutoff = 0.05,
                readable = TRUE)
head(ego)
OUTPUT
ID Description GeneRatio BgRatio
GO:0022626 GO:0022626 cytosolic ribosome 69/2803 123/25856
GO:0030684 GO:0030684 preribosome 62/2803 104/25856
GO:0032040 GO:0032040 small-subunit processome 44/2803 73/25856
GO:0044391 GO:0044391 ribosomal subunit 70/2803 190/25856
GO:0005819 GO:0005819 spindle 119/2803 447/25856
GO:0022627 GO:0022627 cytosolic small ribosomal subunit 28/2803 37/25856
RichFactor FoldEnrichment zScore pvalue p.adjust
GO:0022626 0.5609756 5.174665 16.18263 9.782230e-35 7.336672e-32
GO:0030684 0.5961538 5.499163 16.03109 1.830332e-33 6.863746e-31
GO:0032040 0.6027397 5.559914 13.60415 1.998226e-24 4.995565e-22
GO:0044391 0.3684211 3.398464 11.57047 2.777704e-21 5.208196e-19
GO:0005819 0.2662192 2.455713 10.82570 4.799528e-21 7.199292e-19
GO:0022627 0.7567568 6.980629 12.69399 3.946946e-20 4.933682e-18
qvalue
GO:0022626 5.127948e-32
GO:0030684 4.797397e-31
GO:0032040 3.491637e-22
GO:0044391 3.640255e-19
GO:0005819 5.031926e-19
GO:0022627 3.448384e-18
geneID
GO:0022626 Rplp1/Rpsa/Usp10/Rpl12/Rps19/Rplp0/Rps16/Rpl41/Rplp2/Rpl10a/Rps5/Rpl8/Rps27a/Rps24/Rpl36/Rps25/Rpl23a/Rpl4/Ppargc1a/Rpl18a/Rpl13a/Rpl15/Rps26/Rpl5/Rps3/Rpl18/Rpl19/Rps15/Rps8/Rpl32/Rpl31/Rps7/Rpl27/Rpl7a/Rps3a1/Abce1/Rpl37rt/Rpl11/Rps18/Rpl26/Rpl34/Zfp598/Rpl23/Rps21/Rps20/Rps17/Rpl6/Rpl14/Rps4x/Rps15a/Rps9/Rps10/Gspt1/Rps11/Metap1/Rps29/Rpl3/Rps14/Rps23/Rpl10/Rps2/Rpl35/Rpl36a/Rpl21/Rps28/Etf1/Rps12/Rpl22/Rpl24
GO:0030684 Wdr43/Nob1/Fbl/Ppan/Rcl1/Utp4/Rrp9/Ftsj3/Rrp1b/Rrp15/Noc2l/Rrs1/Nip7/Srfbp1/Nat10/Riok1/Rps19/Rps16/Heatr1/Nop56/Tbl3/Utp25/Nol6/Mrto4/Mphosph10/Rps5/Rps27a/Rps24/Bysl/Noc4l/Rps8/Utp15/Rps7/Dhx37/Rps3a1/Mak16/Krr1/Pno1/Pes1/Wdr46/Rps17/Pwp2/Rps4x/Rps15a/Rps9/Rps11/Wdr74/Ltv1/Rps14/Rps23/Utp18/Rps19bp1/Wdr75/Utp14b/Prkdc/Nop14/Rps28/Ebna1bp2/Riok2/Dimt1/Rps12/Wdr36
GO:0032040 Wdr43/Fbl/Rcl1/Utp4/Rrp9/Nat10/Rps19/Rps16/Heatr1/Nop56/Tbl3/Utp25/Nol6/Mphosph10/Rps5/Rps27a/Rps24/Noc4l/Rps8/Utp15/Rps7/Dhx37/Rps3a1/Krr1/Pno1/Wdr46/Rps17/Pwp2/Rps4x/Rps15a/Rps9/Rps11/Rps14/Rps23/Utp18/Rps19bp1/Wdr75/Utp14b/Prkdc/Nop14/Rps28/Dimt1/Rps12/Wdr36
GO:0044391 Rplp1/Rpsa/Rpl12/Npm1/Rps19/Rplp0/Rps16/Rpl41/Rack1/Rplp2/Rpl10a/Rps5/Rpl8/Rps27a/Rps24/Rpl36/Rps25/Rpl23a/Rpl4/Rpl18a/Rpl13a/Rpl15/Mrpl52/Rps26/Rpl5/Rps3/Rpl18/Rpl19/Rps15/Rps8/Rpl32/Rpl31/Rps7/Rpl27/Rpl7a/Rps3a1/Rpl37rt/Rpl11/Rps18/Rpl26/Rpl34/Rpl23/Rps21/Rps20/Rps17/Rpl6/Rpl14/Rps4x/Rps15a/Mrps30/Rps9/Rps10/Rps11/Mrpl12/Rps29/Mrpl17/Rpl3/Rps14/Rps23/Rpl10/Rps2/Rpl35/Rpl36a/mt-Rnr2/Rpl21/Rps28/Ptcd3/Rps12/Rpl22/Rpl24
GO:0005819 Fam110a/Adrb2/Gpsm2/Nedd9/Rassf10/Cep350/Nsun2/Rps6ka2/Ckap2/Diaph3/Parp4/Luzp1/Kif23/Champ1/Kif15/Slc25a5/Npm1/Ckap2l/Kif11/Arhgef2/Kntc1/Gsk3b/Nek6/Mapre3/Hspa2/Spag5/Tmem201/Rangap1/Tppp/Clasp1/Mapk14/Tpx2/Rps3/Ctdp1/Map4/Kifc1/Afg2a/Hnrnpu/Cdk1/Wdr5/Ckap5/Clasp2/Mtcl1/Nek7/Shcbp1/Kif2a/Lzts2/Git1/Invs/Racgap1/Dzip1l/Tacc3/Kif14/Cdk5rap2/Eml4/Haus4/Ino80/Chmp3/Arl8a/Nusap1/Aurkb/Kmt5b/Prc1/Zzz3/Ect2/Tbccd1/Ccsap/Kat2b/Prpf19/Cenpf/Hmmr/Anxa11/Plk1/Ncor1/Pmf1/Topors/Kif22/Tbl1x/Plekhg6/Ddx11/Ccdc66/Kif2c/Ska1/Hecw2/Mad2l1/Ercc2/Kif20a/Dlgap5/Espl1/Ikbkg/Unc119/Ccnb1/Kif18b/Knstrn/Ralbp1/Cdc20/Cdca8/Mical3/Dctn1/Gem/Cltc/Spice1/Cenpe/Rcc2/Birc5/Cspp1/Bub1b/Dpysl2/Sirt2/Tubb2a/Pard3/Cep63/Cep170/Ppp2cb/Spdl1/Sgo1/Nup62/Cdc27/Csnk1d
GO:0022627 Rpsa/Rps19/Rps16/Rps5/Rps27a/Rps24/Rps25/Rps26/Rps3/Rps15/Rps8/Rps7/Rps3a1/Rps18/Rps21/Rps20/Rps17/Rps4x/Rps15a/Rps9/Rps10/Rps11/Rps29/Rps14/Rps23/Rps2/Rps28/Rps12
Count
GO:0022626 69
GO:0030684 62
GO:0032040 44
GO:0044391 70
GO:0005819 119
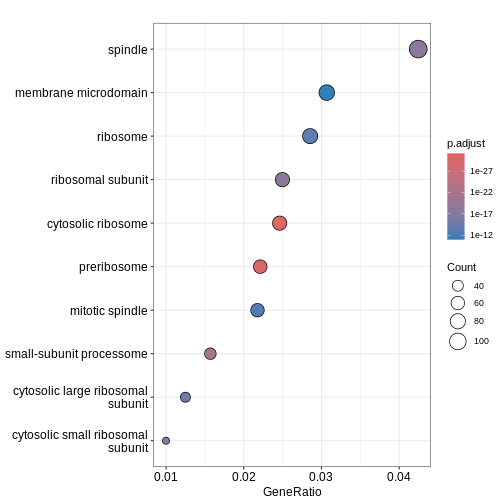
GO:0022627 28We can then use dotplot() function to visualise the
results in the form of a dot plot. From the plot below, we can see that
GO term cellular component spindle, membrane microdomain and ribosome
are top enriched terms.
R
dotplot(ego)
Challenge
Challenge! Can you identify enriched GO term biological process in
deluminal dataset? Are the enriched pathways similar?
Gene Set Enrichment Analysis (GSEA)
We can also perform GSEA using GO database. GSEA is a type of functional class scoring method that evaluates whether genes belonging to a GO term tend to appear at the top or bottom of a ranked gene list, rather than relying on a cut-off (i.e. adj.P.Val < 0.01). The input is a continuous ranking metric (e.g. log2FC) for all genes. This allows the detection of subtle but coordinated shifts in GO terms for both downregulated and upregulated pathways.
We begin by creating a ranked gene list for GSEA by extracting the
logFC values from debasal dataset and its corresponding
ENTREZID. We then sort this vector in a decreasing order so
that the upregulated genes appear at the top of the list and the
downregulated genes at the bottom. Using this ranked gene list, we run
gseGO() to perform GSEA on GO terms CC, by
specifying the organism database, gene ID type, gene set limits and
p-value cut-off for enrichment.
R
debasal_genelist <- debasal$logFC
names(debasal_genelist) <- debasal$ENTREZID
debasal_genelist <- sort(debasal_genelist, decreasing = TRUE)

ego3 <- gseGO(gene          = debasal_genelist,
                OrgDb         = org.Mm.eg.db,
                keyType       = 'ENTREZID',
                ont           = "CC",
              minGSSize    = 100,
              maxGSSize    = 500,
              pvalueCutoff = 0.05,
              verbose      = FALSE)
head(ego3)
OUTPUT
ID Description setSize
GO:0030684 GO:0030684 preribosome 103
GO:0022626 GO:0022626 cytosolic ribosome 108
GO:0000776 GO:0000776 kinetochore 164
GO:0000779 GO:0000779 condensed chromosome, centromeric region 175
GO:0000775 GO:0000775 chromosome, centromeric region 240
GO:0044391 GO:0044391 ribosomal subunit 173
enrichmentScore NES pvalue p.adjust qvalue rank
GO:0030684 0.6638177 2.333843 1.000000e-10 3.300000e-09 2.252632e-09 3377
GO:0022626 0.6468668 2.309985 1.000000e-10 3.300000e-09 2.252632e-09 4038
GO:0000776 0.5705673 2.154430 1.000000e-10 3.300000e-09 2.252632e-09 1254
GO:0000779 0.5655402 2.153290 1.000000e-10 3.300000e-09 2.252632e-09 1254
GO:0000775 0.5303003 2.077751 1.000000e-10 3.300000e-09 2.252632e-09 1417
GO:0044391 0.5545608 2.101866 3.846466e-10 1.057778e-08 7.220559e-09 4724
leading_edge
GO:0030684 tags=64%, list=21%, signal=51%
GO:0022626 tags=76%, list=26%, signal=57%
GO:0000776 tags=24%, list=8%, signal=23%
GO:0000779 tags=24%, list=8%, signal=22%
GO:0000775 tags=22%, list=9%, signal=20%
GO:0044391 tags=62%, list=30%, signal=44%
core_enrichment
GO:0030684 72515/59028/14113/235036/67223/72462/215193/59014/67973/67619/98956/27966/217995/56095/57741/67222/69902/66538/67134/213773/21771/105372/66164/53414/67920/78294/71340/208144/57750/107071/20085/110816/57315/52705/230082/20055/20115/20116/217109/20103/20088/64934/66249/68052/66254/100608/54127/20091/67045/20042/73674/353258/20068/76846/72554/267019/20102/20044/27207/69072/195434/225348/14791/57294/66475/27993
GO:0022626 16785/56040/269261/22224/20084/19982/68436/22186/78294/67186/67097/20085/67671/20055/19951/11837/100503670/20115/27367/20116/54217/27370/76808/20103/270106/268449/20088/19896/67025/68052/20090/75617/24015/20054/27050/54127/26961/67115/67891/67945/114641/22121/19946/20091/19899/20042/66489/100502825/67427/75624/213753/66480/66481/65019/19921/20068/19988/19933/76846/267019/20102/20044/27207/19981/19942/14852/19941/57294/66475/19944/225363/27176/57808/16898/19934/110954/68193/11815/67281/207214/105083/319195
GO:0000776 20877/12235/66468/66977/66570/108000/67629/12236/76464/208628/26886/268697/18817/102920/54141/67052/18005/60411/107995/72415/68549/70385/22137/11799/73804/51944/72155/229841/381318/71876/68014/67177/56150/69928/66934/66442/67037/19387/101994/236930
GO:0000779 20877/12235/66468/66977/54392/66570/108000/67629/12236/76464/208628/26886/12615/268697/18817/102920/54141/67052/18005/60411/107995/72415/68549/70385/22137/11799/73804/51944/72155/229841/381318/71876/68014/67177/56150/69928/66934/66442/67037/19387/101994/236930
GO:0000775 20877/12235/66468/66977/54392/66570/108000/52276/67629/72107/12236/70645/76464/208628/26886/12615/71988/268697/18817/102920/54141/67052/18005/60411/217653/107995/72415/68549/70385/22137/11799/73804/51944/21973/72155/229841/381318/217578/71876/68014/67177/56150/17345/69928/66934/66442/67037/19387/101994/236930/319160/218973/219114
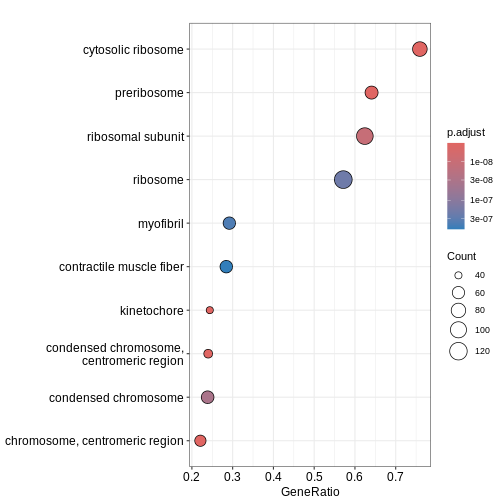
GO:0044391 16785/56040/269261/20084/56282/19982/66973/68436/22186/78294/67186/67097/20085/67671/20055/18148/19951/11837/100503670/20115/14694/68836/27367/20116/54217/27370/76808/20103/270106/268449/20088/19896/67025/68052/20090/75617/69163/20054/27050/54127/26961/67115/67891/67945/114641/22121/19946/20091/19899/20042/66489/59054/100502825/67427/60441/66480/66481/65019/19921/27397/20068/118451/19988/19933/76846/267019/69956/79044/20102/20044/27207/78523/19981/19942/66230/19941/57294/66475/19944/94063/27176/57808/16898/102060/66258/19934/110954/28028/68193/75398/67281/207214/319195/50529/26451/66121/14109/19989/20104/64657/64655/66407/20005/94065/216767/67840/67308/19943R
dotplot(ego3)
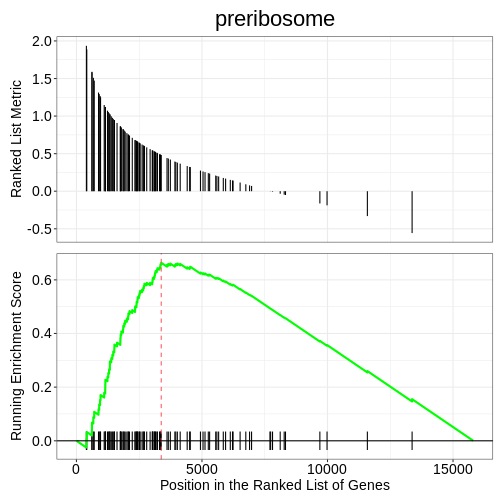
We can also use the gseaplot() function to visualise
GSEA result for a specific gene set. In this example, we select the
top-ranked enriched GO term (geneSetID = 1). The result-ing plot
displays how genes contributing to the enrichment of this GO term are
distributed in the ranked gene list.
R
gseaplot(ego3, by = "all", title = ego3$Description[1], geneSetID = 1)
- GO terms are divided into Biological Process (BP), Molecular Function (MF) and Cellular Component (CC), which can be analysed separately or together depending on the biological question.
- The
enrichGO()andgseGO()functions inclusterProfilerallow users to perform ORA and GSEA using the GO database directly. - GO testing results highlight gene sets or pathways that are overrepresented in your dataset, allowing interpretation of downregulated or upregulated genes.