Analysis with RegEnrich
Last updated on 2025-12-02 | Edit this page
Estimated time: 12 minutes
Overview
Questions
- How can we use
RegEnrichto identify key transcriptional regulators from RNA-seq data? - What inputs does
RegEnrichneed (expression matrix, metadata, list of regulators)? - Why do we need mouse-specific transcription factor (TF) information instead of the built-in human TFs?
Objectives
- Understand the overall purpose of
RegEnrichin identifying key regulators (e.g. TFs). - Load a mouse transcription factor list suitable for use with
RegEnrich. - Prepare an expression matrix, design matrix, and contrast for a
RegenrichSetobject. - Run the main
RegEnrichpipeline and inspect the resulting ranked regulators.
Analysis with RegEnrich
RegEnrich is used to identify potential key
regulators (e.g. transcription factors) that may be driving the
gene expression changes observed in your RNA-seq experiment.
At a high level, the workflow looks like this:
-
Expression data: log-transformed expression matrix
(genes × samples).
-
Differential expression: identify genes that differ
between groups (e.g.
limma). -
Network construction: build a regulator–target
network (e.g. co-expression).
-
Enrichment testing: test whether targets of a
regulator are enriched among DE genes.
- Ranking: combine evidence to give each regulator a score and rank.
Before we set up RegEnrich properly, we will explore the
default TF list that comes with the package and see why it is not
appropriate for this mouse dataset.
Spot the problem: built-in TFs vs mouse data
-
Load the built-in transcription factor list:
R
data(TFs) Inspect the TFs object:
- What kinds of identifiers are used (e.g. gene symbols, Entrez IDs)?
- Which species do these transcription factors belong to?
- Based on what you see:
- Why might using TFs be a problem for our mouse expression dataset?
- What could go wrong in the analysis if we use human TFs with mouse RNA-seq data?
Using a mouse TF list from TcoF-DB
The TFs included in the package are human-only, so for mouse data we must provide our own list of mouse transcription factors.
For this workshop, we will use mouse TFs from TcoF-DB. You can directly download the file that we will be using from this link.
The code below shows how to:
- Load a mouse TF list from a CSV file.
- Prepare an expression matrix for RegEnrich.
- Create a RegenrichSet object.
- Run the main RegEnrich pipeline and inspect the results.
R
# Load mouse transcription factors (must include a "GeneID" column)
mouseTFs <- read.csv('data/BrowseTF_TcoF-DB.csv')

# Prepare expression matrix: genes x samples
logcounts <- filteredcounts[,4:15]
rownames(logcounts) <- filteredcounts$ENTREZID

# Convert to log CPM for RegEnrich
logcounts <- cpm(logcounts,log=TRUE)

# Define design (uses CellTyoeStatus metadata) and example contrast
design = model.matrix(~ factordata$CellTypeStatus)
contrast = c(-1, 1,0,0,0,0)

# Initialise a RegenrichSet object
object = RegenrichSet(expr = logcounts,
                      colData = factordata,
                      reg = unique(mouseTFs$GeneID), # regulators
                      method = "limma", # differential expression analysis method
                      design = design, # design model matrix
                      contrast = contrast, # contrast
                      networkConstruction = "COEN", # network inference method
                      enrichTest = "FET") # enrichment analysis method

print(object)
The regenrich_diffExp step can take a while. We have
already run this step for you and you can download the object data
directly using this link.
R
# Perform RegEnrich analysis
set.seed(123)

# This step takes a while
object = regenrich_diffExpr(object) %>%
  regenrich_network() %>%
  regenrich_enrich() %>%
  regenrich_rankScore()


# Obtain results (ranked regulators)
res = results_score(object)
print(res)

# Visualise regulator-target expression for selected regulator
plotRegTarExpr(object, reg = "71371")
OUTPUT
# A tibble: 653 × 5
   reg    negLogPDEA negLogPEnrich logFC score
 * <chr>       <dbl>         <dbl> <dbl> <dbl>
 1 226442      10.4           41.5 -6.96  1.64
 2 70579       10.6           39.7 -8.24  1.63
 3 434484       8.15          51.0 -4.68  1.62
 4 22025        8.07          49.2 -5.11  1.59
 5 20185       11.3           33.6 -8.13  1.58
 6 15273        7.88          47.5 -6.86  1.54
 7 20788       10.4           34.8 -9.65  1.52
 8 22344        9.64          38.3 -7.05  1.52
 9 114774       9.50          37.0 -7.64  1.49
10 21833        8.53          41.3 -6.50  1.48
# ℹ 643 more rows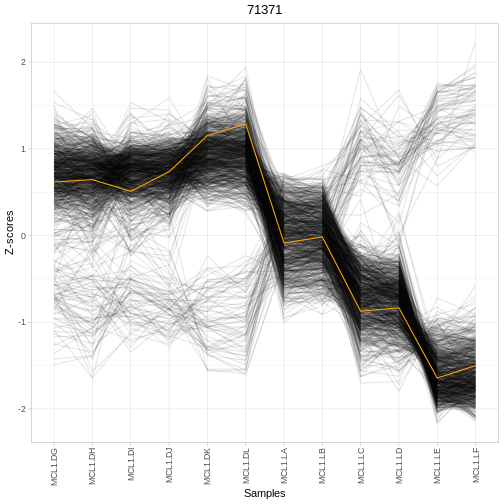
RegEnrich uses a design matrix and contrast in a similar
way to limma: they define which groups you want to compare.
We create a design matrix from a factor in our sample metadata:
design <- model.matrix(~ factordata$CellTypeStatus)
This turns the factor CellTypeStatus into one column per
group (plus an intercept). A contrast vector then specifies how to
combine these columns to define a comparison.
For example, a contrast like:
contrast <- c(-1, 1, 0, 0, 0, 0)
means:
- Compare group 2 vs group 1
- i.e. “group 2 MINUS group 1”
- All other groups are ignored (set to 0)
The exact mapping of positions in the contrast to group names depends
on the order of the factor levels in
factordata$CellTypeStatus.
Test your understanding: contrasts
Look at the factor levels in
factordata$CellTypeStatus:
R
levels(factordata$CellTypeStatus)
- How many groups are there?
- Which group is used as the baseline (reference) in the design matrix?
- Write a contrast that compares Luminal pregnant vs Basal pregnant.
- In words, what biological question does that contrast represent?
The number of groups equals the number of unique levels returned by
levels(factordata$CellTypeStatus)
The baseline group is the first level of the factor.
If the factor levels are ordered like:
[1] “Basal pregnant” “Basal lactate” “Luminal pregnant” “Luminal lactate” “Stem” “Other”
Then the corresponding contrast to compare Luminal pregnant vs Basal pregnant is:
contrast <- c(-1, 0, 1, 0, 0, 0)
This means:
1 → Luminal pregnant
-1 → Basal pregnant
0 → all other groups ignored
The biological question this is answering is:
“Which transcriptional regulators differ between Luminal pregnant and Basal pregnant samples?”
That is, regulators that functionally distinguish these two cell states.
Inspecting and interpreting RegEnrich results
The results_score(object) call returns a table of
regulators with associated statistics. Typical columns summarise: - The
regulator identifier (e.g. Entrez ID or gene symbol) - Evidence from
differential expression and/or network structure - A combined score used
to rank regulators (higher often = more influential)
A simple way to start exploring is to look at the top regulators and their expression patterns across conditions: - Are top-ranked regulators differentially expressed between groups? - Do their predicted targets show coordinated expression changes? - Does the expression of a regulator and its targets match your biological expectations?
Interpreting regulator results
Using the output table res: - Identify the top 3
regulators by whatever ranking column is provided
(e.g. rankScore). - For one of these regulators, check its
expression across samples using plotRegTarExpr(). - Does
this pattern support the idea that this regulator is involved in the
contrast you specified? - How might you follow this up
experimentally?
-
RegEnrichhelps identify potential regulatory drivers (e.g. TFs) behind observed gene expression changes. - The package’s built-in TF dataset
(data(TFs))is human-specific and not suitable for mouse RNA-seq analysis. - For mouse data, a mouse-specific TF list (e.g. from TcoF-DB) must be supplied via the reg argument.
- A RegenrichSet object requires: an expression matrix, sample metadata, a regulator list, and a design/contrast specification.