Gene set enrichment analysis with fgsea
Last updated on 2025-12-02 | Edit this page
Estimated time: 12 minutes
Overview
Questions
- What is Gene Set Enrichment Analysis (GSEA) and when should I use it?
- How does fgsea perform fast, ranked-list GSEA?
- How do I interpret enrichment scores, p-values, and leading-edge genes?
- How does fgsea differ from the GSEA functions in clusterProfiler?
Objectives
- Prepare a ranked gene list suitable for GSEA.
- Run the ‘fgsea’ algorithm on Hallmark or other gene sets.
- Identify enriched pathways and distinguish between up- and down-regulated sets.
- Use ‘plotEnrichment()’ and ‘plotGseaTable()’ to visualise and interpret results.
- Understand the conceptual differences between ‘fgsea’ and ‘clusterProfiler::gseGO/gseKEGG’
What is GSEA (in practice)?
Unlike over-representation analysis (ORA), which tests a
subset of significant genes,
Gene Set Enrichment Analysis (GSEA) uses a ranked list of all
genes, such as:
- t-statistics
- log fold changes
- Wald statistics
This helps detect coordinated but subtle shifts across entire pathways that might be missed by threshold-based methods.
The fgsea package implements a fast,
permutation-efficient version of the original Broad Institute GSEA
algorithm, allowing thousands of pathways to be tested quickly.
In this part of the workshop, we will:
- Create a ranked list of genes from the
debasaldataset - Run
fgsea()using the mouse Hallmark gene sets(Mm.H). - Explore the top enriched pathways
- Visualise both multiple pathways and a single pathway in detail
Gene Set Enrichment Analysis with fgsea
Let’s perform Gene Set Enrichment Analysis using the
fgsea package.
R
# Prepare ranked list of genes
# Subset the columns we need (ENTREZID + t-statistic)
# and sort genes by t-statistic (decreasing = FALSE → most negative → most positive)
rankedgenes_df <- debasal[order(debasal$t, decreasing = FALSE), c("ENTREZID", "t")]
# Create the numeric vector of t-statistics
rankedgenes <- rankedgenes_df$t
# Name each t-statistic value with the corresponding Entrez ID
# fgsea() requires a *named* numeric vector:
# - values = ranking metric (t-statistics)
# - names = gene identifiers (Entrez IDs)
names(rankedgenes) <- rankedgenes_df$ENTREZID
# Perform fgsea
# pathways = Mm.H (Hallmark gene sets loaded earlier)
# stats = ranked gene list (t-statistics)
# minSize = minimum number of genes required per pathway
fgseaRes <- fgsea(pathways = Mm.H, stats = rankedgenes, minSize = 15)
# Extract top enriched pathways
# Up-regulated pathways (ES > 0), ordered by smallest p-value
topPathwaysUp <- fgseaRes[ES > 0][head(order(pval), n=10), pathway]
# Down-regulated pathways (ES < 0), ordered by smallest p-value
topPathwaysDown <- fgseaRes[ES < 0][head(order(pval), n=10), pathway]
# Combine: first up-regulated, then reversed down-regulated
topPathways <- c(topPathwaysUp, rev(topPathwaysDown))
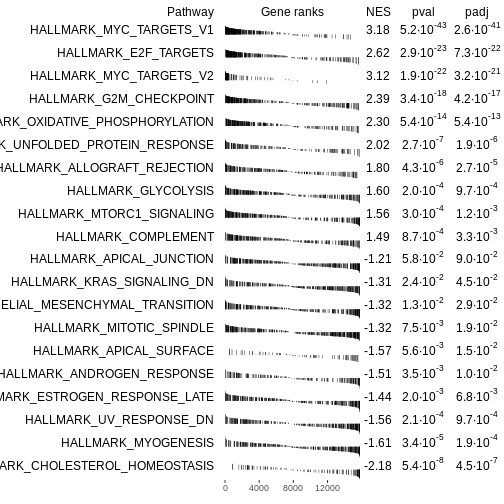
# Plot a table of enrichment results
plotGseaTable(Mm.H[topPathways], rankedgenes, fgseaRes,
gseaParam=0.5)
R
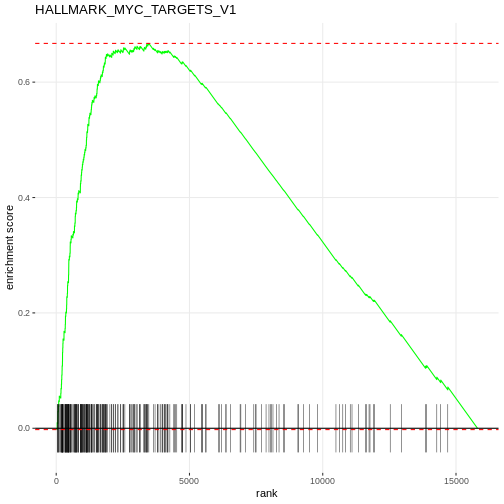
# Plot the enrichment curve for the top pathway
# Visualise a single pathway: running enrichment score vs. ranked genes.
plotEnrichment(Mm.H[[topPathwaysUp[1]]], rankedgenes) + labs(title = topPathwaysUp[1])
Apply fgsea to the deluminal contrast
Repeat the GSEA analysis using the deluminal dataset
instead of debasal.
- Create a ranked gene list using the
tstatistic fromdeluminal. - Run
fgsea()with the same Hallmark gene sets (Mm.H). - Identify the top 5 enriched pathways.
- Are they different from the
debasalresults? What biological differences might explain this?
R
# Create a ranked gene list for the deluminal contrast
rankedgenes_df_del <- deluminal[order(deluminal$t, decreasing = FALSE),
                                c("ENTREZID", "t")]
rankedgenes_del <- rankedgenes_df_del$t
names(rankedgenes_del) <- rankedgenes_df_del$ENTREZID

# Run fgsea
fgseaRes_del <- fgsea(pathways = Mm.H,
                      stats    = rankedgenes_del,
                      minSize  = 15)

# View the top 5 pathways
fgseaRes_del[order(pval)][1:5, ]
Differences between fgseaRes (from debasal) and fgseaRes_del are expected and likely reflect biological differences between the two contrasts (e.g., different cell types or experimental conditions).- GSEA evaluates enrichment across a ranked list of all genes, not just a subset of significant ones.
- The
fgseapackage provides a fast implementation of GSEA suitable for large RNA-seq datasets. - A positive NES indicates enrichment among up-regulated genes, while a negative NES indicates enrichment among down-regulated genes.
-
plotGseaTable()andplotEnrichment()help visualise how pathways behave across the ranked gene list. - Compared with
clusterProfilers GSEA functions,fgseafocuses on speed and flexibility, whileclusterProfilerprovides tighter integration with specific databases (e.g., GO, KEGG) and additional plotting helpers.