Introduction
Gene Ontology testing with clusterProfiler
Figure 1
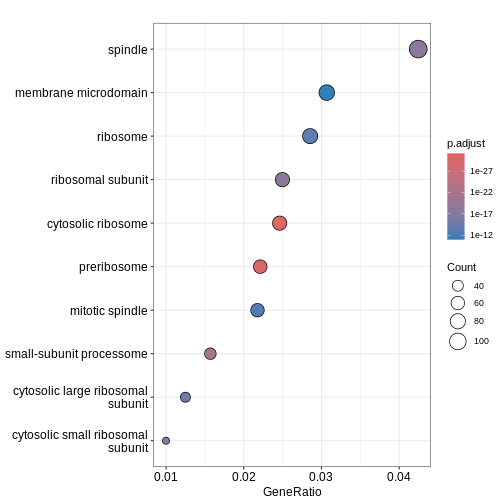
Figure 2
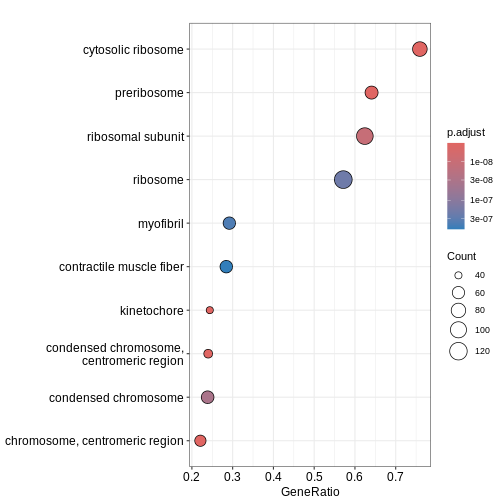
Figure 3
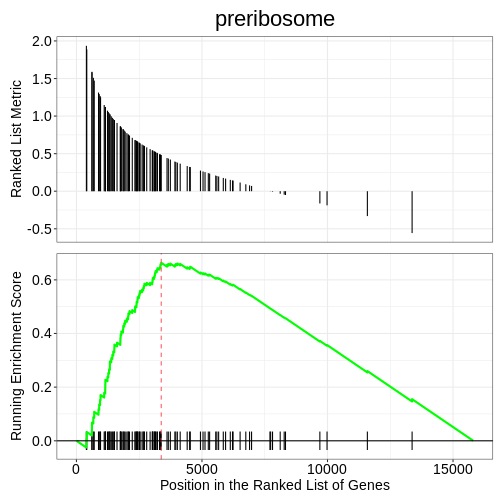
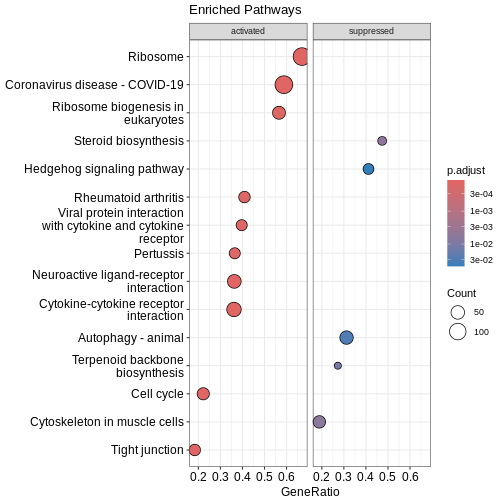
KEGG enrichment analysis with clusterProfiler
Figure 1
 ### Similarity-based network plots Next, we can explore how the enriched
pathways relate to one another.
### Similarity-based network plots Next, we can explore how the enriched
pathways relate to one another.
The enrichment map groups pathways that share many genes, helping us see
broader biological themes rather than isolated pathways. In this case,
pairwise_termsim() function calculates the similarity
between enriched KEGG pathways and produces a similarity matrix that
quantifies their relationship. The emapplot()generates an
enrichment map using the similarity matrix produced, visualising the
enriched pathways as a network with nodes representing pathways and
edges reflecting their similarity.
Figure 2
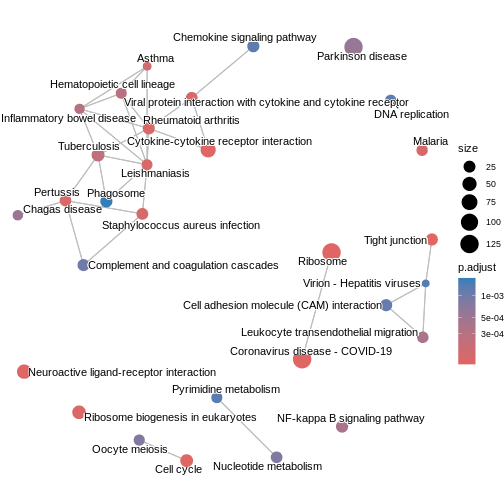
Figure 3
 ### Ridge plot We can also inspect the distribution of enrichment scores
across pathways with
### Ridge plot We can also inspect the distribution of enrichment scores
across pathways with ridgeplot(). This shows how strongly
and broadly each pathway is enriched across the ranked gene list using
overlapping density curves.
Figure 4
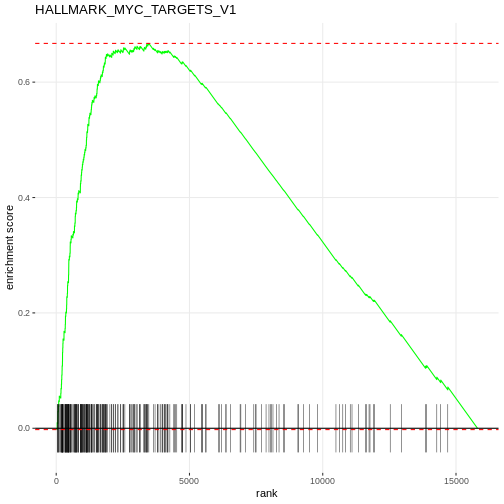
Gene set enrichment analysis with fgsea
Figure 1
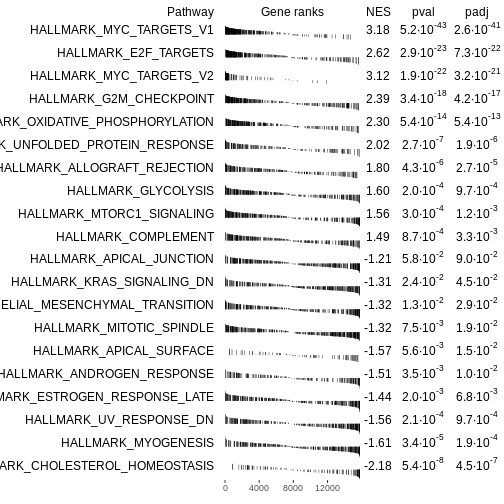
Figure 2
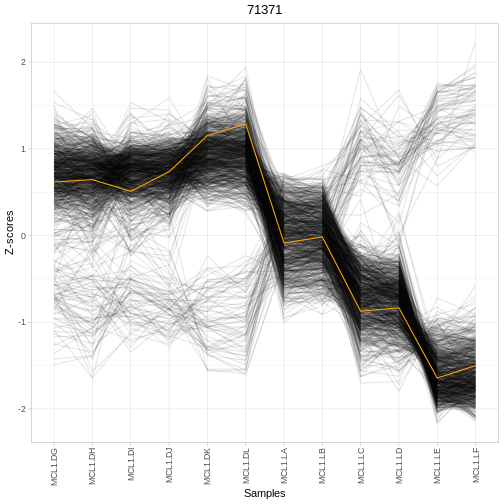
Analysis with RegEnrich
Figure 1
Interaction networks with StringDB
Figure 1
